futuresearch evals
Want to run on our benchmarks? Please contact us at evals@futuresearch.ai.
How our forecasting and research agents perform on our own benchmarks, on live public leaderboards, and on real markets.
Bench to the Future 3 (BTF-3)
BTF-3 is the third edition of our pastcasting benchmark: 1,907 resolved forecasting questions — 1,515 binary and 392 numeric — researched and forecast against a frozen web corpus. The dataset is available at huggingface.co/datasets/BTF-2/BTF-3. Paper to follow.
BTF-3 Leaderboard
Evaluated: June–July 2026
All scores are on the Brier scale; lower is better, and the best score in each column is bolded.
Agent | Pooled score(n=1,907) | Binary(Brier, n=1,515) | Numeric(RPS, n=392) |
|---|---|---|---|
1FutureSearch SOTA*§ | 0.116 [0.108–0.123] | 0.115 [0.105–0.126] | 0.116 [0.106–0.127] |
2Claude Opus 5 (xhigh)§ | 0.118 [0.111–0.126] | 0.117 [0.107–0.127] | 0.120 [0.110–0.130] |
3Claude Opus 4.8 (xhigh) | 0.130 [0.123–0.138] | 0.131 [0.121–0.142] | 0.129 [0.119–0.139] |
4Claude Fable 5 (high) | 0.131 [0.123–0.138] | 0.132 [0.122–0.143] | 0.129 [0.119–0.139] |
5GPT-5.5 (high, agent SDK)‡ | 0.134 [0.128–0.140] | 0.142 [0.134–0.150] | 0.124 [0.114–0.135] |
6GPT-5.6 Sol (high) | 0.135 [0.128–0.143] | 0.141 [0.132–0.150] | 0.129 [0.117–0.141] |
7Claude Opus 4.8 (high, agent SDK)‡ | 0.137 [0.129–0.145] | 0.135 [0.124–0.146] | 0.140 [0.130–0.151] |
8Claude Opus 4.8 (high) | 0.140 [0.132–0.147] | 0.135 [0.125–0.146] | 0.145 [0.134–0.157] |
9GPT-5.5 (high) | 0.143 [0.136–0.149] | 0.148 [0.140–0.156] | 0.136 [0.125–0.147] |
10Claude Sonnet 5 (xhigh) | 0.154 [0.146–0.162] | 0.154 [0.144–0.164] | 0.154 [0.143–0.166] |
Binary questions are scored by the Brier score (mean squared error of the forecast probability), numeric questions by a normalized ranked probability score (RPS), which generalizes the Brier score to distributional forecasts. The pooled score averages across all questions, counting each numeric question three times as much as a binary one (numeric forecasts are more informative per question).
Brackets are 95% confidence intervals, computed by percentile bootstrap (5,000 resamples of the question set).
* FutureSearch SOTA synthesizes forecasts from multiple FutureSearch agent runs. ‡ Self-driving run via the model vendor's agent SDK (Claude Agent SDK / OpenAI Agents SDK) instead of our forecasting agent. FutureSearch SOTA is missing 80 binary questions (n=1,435) and 4 numeric questions (n=388). Claude Fable 5 (high) is missing 29 binary questions (n=1,486) and 3 numeric questions (n=389). GPT-5.5 (high, agent SDK) is missing 50 binary questions (n=1,465) and one numeric question (n=391). Claude Opus 4.8 (high, agent SDK) is missing 8 binary questions (n=1,507).
§ Claude Opus 5 reports a May 2026 training cutoff, significantly closer to our question snapshots (late April to May 2026) than any other model on the board. We found no leakage of resolutions, but a fresher cutoff may still give it an advantage. The FutureSearch SOTA row carries the same mark because Claude Opus 5 is one of the agent runs it synthesizes from.
How we checked for leakage
Every question in this benchmark is asked as of an anchor date in late April or May 2026 and resolves in June or July. Claude Opus 5 reports a May 2026 training cutoff, so it could in principle have seen outcomes it is asked to forecast. Before publishing the Claude Opus 5 row we ran the following checks on it.
Recall probes. We asked Claude Opus 5 forced-choice questions about hard-to-guess May 2026 events (the Kentucky Derby winner, the Eurovision winner, the PGA Championship, the Champions League final, Colombia's first-round result). It scored 0 of 5 on the events a May-trained model should know, and also missed April's Masters winner. Its recallable knowledge fades around March 2026, well before the question anchors.
Timing gradients. If Claude Opus 5 had absorbed outcomes, its advantage should concentrate on questions asked or resolved closest to its training window. The opposite holds: its edge over the other models is flat to slightly increasing for later anchor dates, and questions resolving within days of a late-May cutoff show less of its advantage than questions resolving six weeks later.
Confidence audit. A model that knows outcomes produces unusual numbers of near-certain forecasts. Claude Opus 5 made fewer forecasts at or beyond 98 percent certainty than most other models on the board, and there is no question where it was near-certain and correct while every other model disagreed.
Trace audit. In Claude Opus 5's largest wins over the field, every load-bearing source it cited was published before the question's anchor date and was available to all models through the shared research snapshots. Most of those wins were correctly skeptical "no" calls on deadline-driven questions, a research-skill signature rather than a foreknowledge one. A sample of its search queries showed no terms whose relevance only emerged after the anchor dates.
What we cannot rule out: because Claude Opus 5 was trained closer to the anchor dates, it knows the spring 2026 news landscape better, which can make its research more targeted even with no knowledge of outcomes. This recency advantage exists in smaller degrees between all models on the board, which report training cutoffs ranging from January to May 2026.
CHAMPS KNOW strategic emphasis
Mean Borda score per dimension (rank 1 = 10 … rank 10 = 1); higher means the dimension is more prominent in the agent's rationales. The top 3 agents are shown by default — click a name to add or remove it.
Best Brier per dollar
Accuracy against average LLM cost per question
Cost is the actual LLM spend of each configuration averaged over all forecasts it made on the benchmark, including refused and not-yet-resolved questions; infrastructure (search, hosting) is not included. Error bars are the same 95% bootstrap confidence intervals as in the leaderboard table. Points on the dotted Pareto frontier are drawn larger: no other configuration is both cheaper and more accurate. FutureSearch SOTA synthesizes forecasts from multiple agent runs, so it has no single-run cost and is not shown.
Pairwise comparisons
Paired bootstrap on pooled scores (numeric weighted 3×)
Each cell is the difference in pooled score (row − column) on the questions both agents forecast; negative (green) means the row agent is more accurate. Bold, bordered cells are statistically significant (two-sided paired-bootstrap * p<.05, ** p<.01, *** p<.001); grey cells are not. Hover a cell for the 95% confidence interval, p-value, and shared question count.
Bench to the Future 2 (BTF-2)
BTF-2 evaluates agents on 1,417 hard forecasting questions. Agents research and forecast offline against a frozen 15M-document corpus. Rationales and reasoning traces are evaluated for strategic reasoning.
BTF-2 Leaderboard
Last updated: 2026-04-20
Agent | Brier (accuracy) | Calibration | Refinement |
|---|---|---|---|
| FutureSearch Agent | 0.119 | 0.002 | 0.081 |
| Opus 4.6 Agent | 0.130 | 0.005 | 0.075 |
| Gemini 3.1 Pro Agent | 0.141 | 0.012 | 0.069 |
| GPT-5.4 Agent | 0.152 | 0.010 | 0.056 |
| Grok 4.20 Beta Agent | 0.165 | 0.003 | 0.039 |
Brier scores on 1,417 pastcasting questions (lower is better). The FutureSearch Agent is an ensemble significantly more accurate than any single frontier agent. Radar chart shows CHAMPS KNOW strategic emphasis (Borda scores, 8 of 10 dimensions).
Papers
Datasets
Deep Research Bench (DRB)
DRB benchmarks how well LLM agents do research on the web. Each of the 0 diverse, real-world tasks provides 10-100k webpages stored offline for search and reasoning, accompanied by carefully curated answers.
DRB Leaderboard
Last updated:
Agent | Score | Cost ($) | Runtime (s) |
|---|---|---|---|
Scores averaged first per task category (radar chart), then across all tasks (table). Runtime is estimated from ReAct steps, not wall-clock time.
Papers
Metaculus AI Forecasting Tournaments
Metaculus runs live tournaments where forecasters predict real, unresolved questions and are scored against the field by peer score. Most are bot-only; the Metaculus Cup and the Market Pulse Challenge put bots up against human forecasters, and on those we report where we place against the humans. Our standing in the tournaments we take part in, refreshed at each deploy:
| Tournament | Our standing | Leader |
|---|---|---|
| Summer 2026 FutureEval Bot Tournamentlive | #1 of 194 | FutureSearch (1595.39) |
| Metaculus Cup Summer 2026live | Ranked above #5 human | laertes (555.74), FutureSearch (413.11) |
| Market Pulse Challenge 26Q3live | Ranked above #5 human | MarcosO (684.50), FutureSearch (634.36) |
| MiniBench - 2026-07-13 | #2 of 147 | metac-azimuth (831.91), FutureSearch (801.32) |
| MiniBench - 2026-06-29 | #1 of 132 | FutureSearch (732.76) |
| MiniBench - 2026-06-15 | #1 of 116 | FutureSearch (1267.95) |
| MiniBench - 2026-06-01 | #2 of 111 | laertes (740.66), FutureSearch (578.48) |
Standings are pulled from the Metaculus API at deploy time. Entrants are scored by peer score (a per-question comparison against every other forecaster on the same question); higher is better. The leader column shows the top-scoring competitor in the whole field, bot or human; where that isn't us, our score follows for comparison. MiniBench tournaments run on a rolling two-week cadence.
On the Metaculus Cup and Market Pulse, bots and humans forecast the same questions but Metaculus ranks only the human accounts, since bots are not prize-eligible. “Ranked above #N human” means our score beats the forecaster Metaculus ranks Nth among the humans.
ForecastBench
ForecastBench is a dynamic, contamination-free benchmark of AI forecasting accuracy run by the Forecasting Research Institute. Bots forecast hundreds of unresolved real-world questions, scored on a Brier Index (0–100, higher is better). Our top bot's standing, refreshed at each deploy:
| Leaderboard | Our standing | Leader |
|---|---|---|
| Tournament leaderboard | #23 of 259 | Superforecaster median forecast (69.1), FutureSearch (66.7) |
The tournament leaderboard ranks every submitted entry by its overall Brier Index across dataset and market questions; it is regenerated nightly from the public dataset repository. The Brier Index rescales the mean Brier score to a 0–100 scale (100 = perfect, 50 = uninformed) and adjusts for question difficulty. Our standing is our best-ranked bot; the leader column shows the top-ranked entry, with our score alongside for comparison.
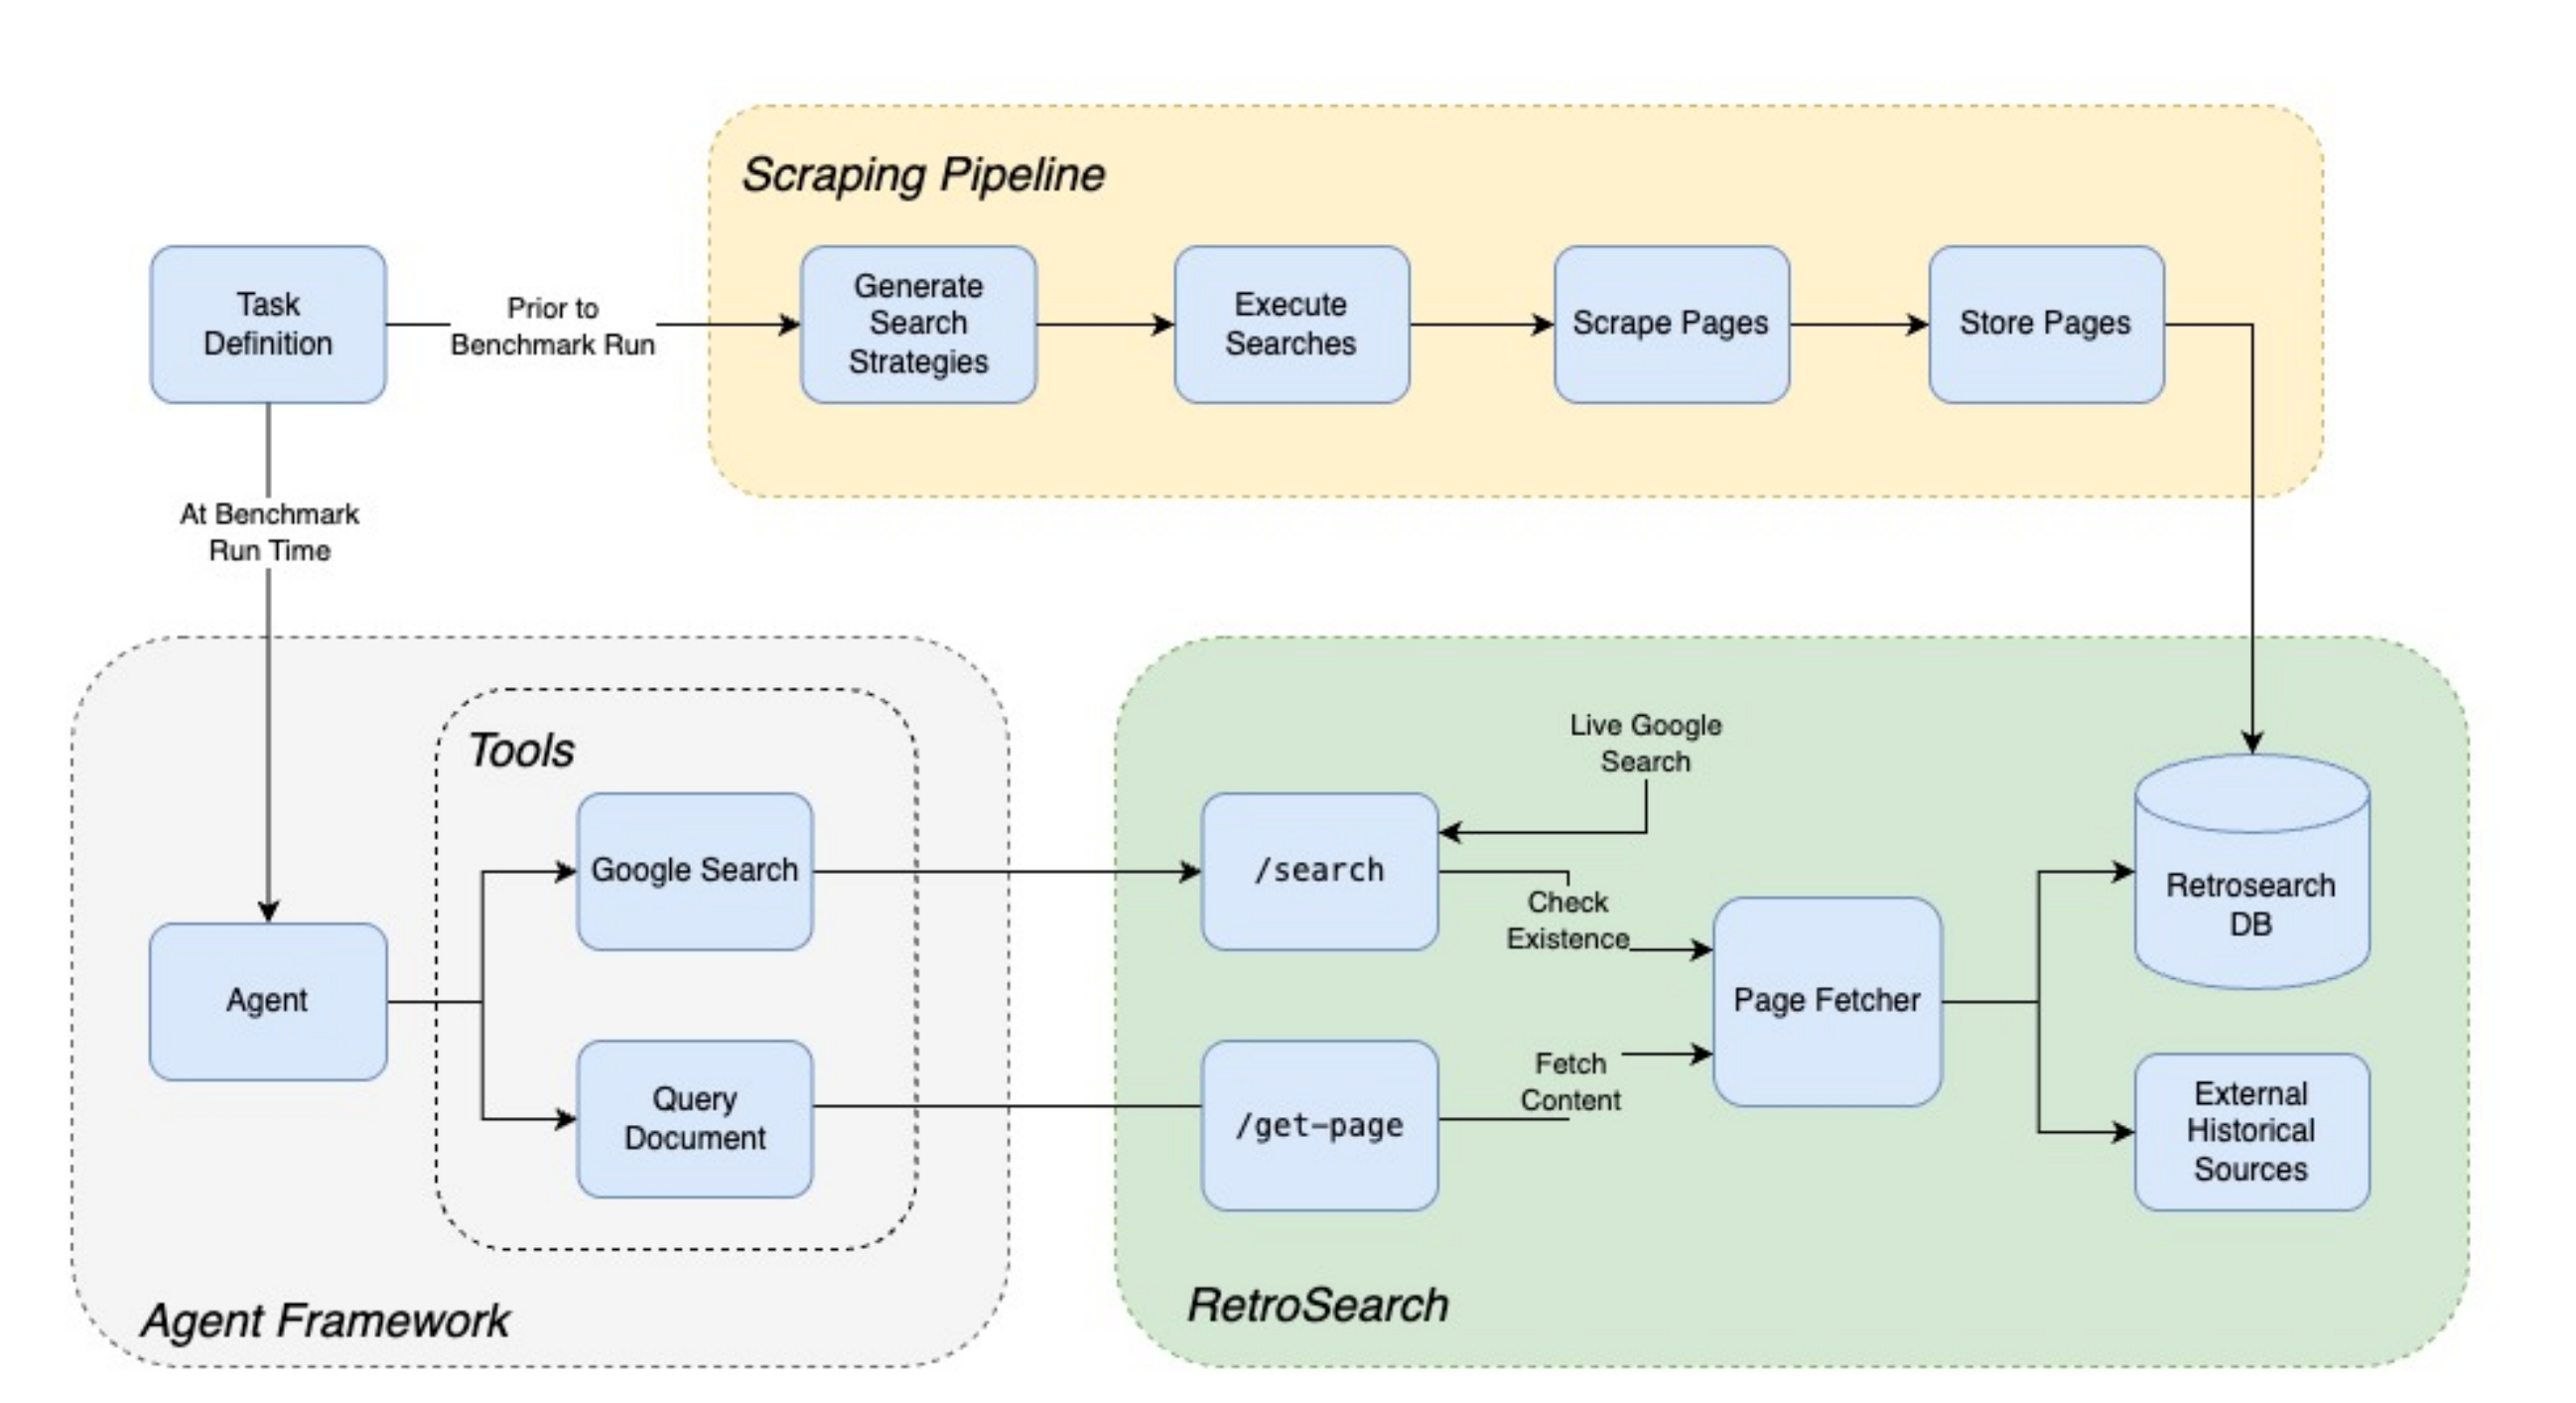
RetroSearch
DRB and BTF-2 use RetroSearch, a system designed to serve agents a frozen, previously scraped version of the internet instead of the live pages, allowing reproducible runs even as the internet changes, and enabling forecasting tasks to be run as "pastcasting".
RetroSearch aims to emulate Google search (specifically, the Serper search API) as closely as possible, so as to minimize differences between live and "retro" agent runs. A single RetroSearch search query follows the following steps:
- Run a live Serper search for the query
- Look up pages obtained from live search in the RetroSearch database and other archive sources
- If the page is not found in the RetroSearch database, remove it from the results
- Write new snippets from a sample of page content using a simple LLM
- Return the results in the original format of the Google results
This approach ensures a search experience for agents that is consistent with real search, but backed exclusively by pages we have a frozen candidate for. The following diagram from the paper illustrates the process: